
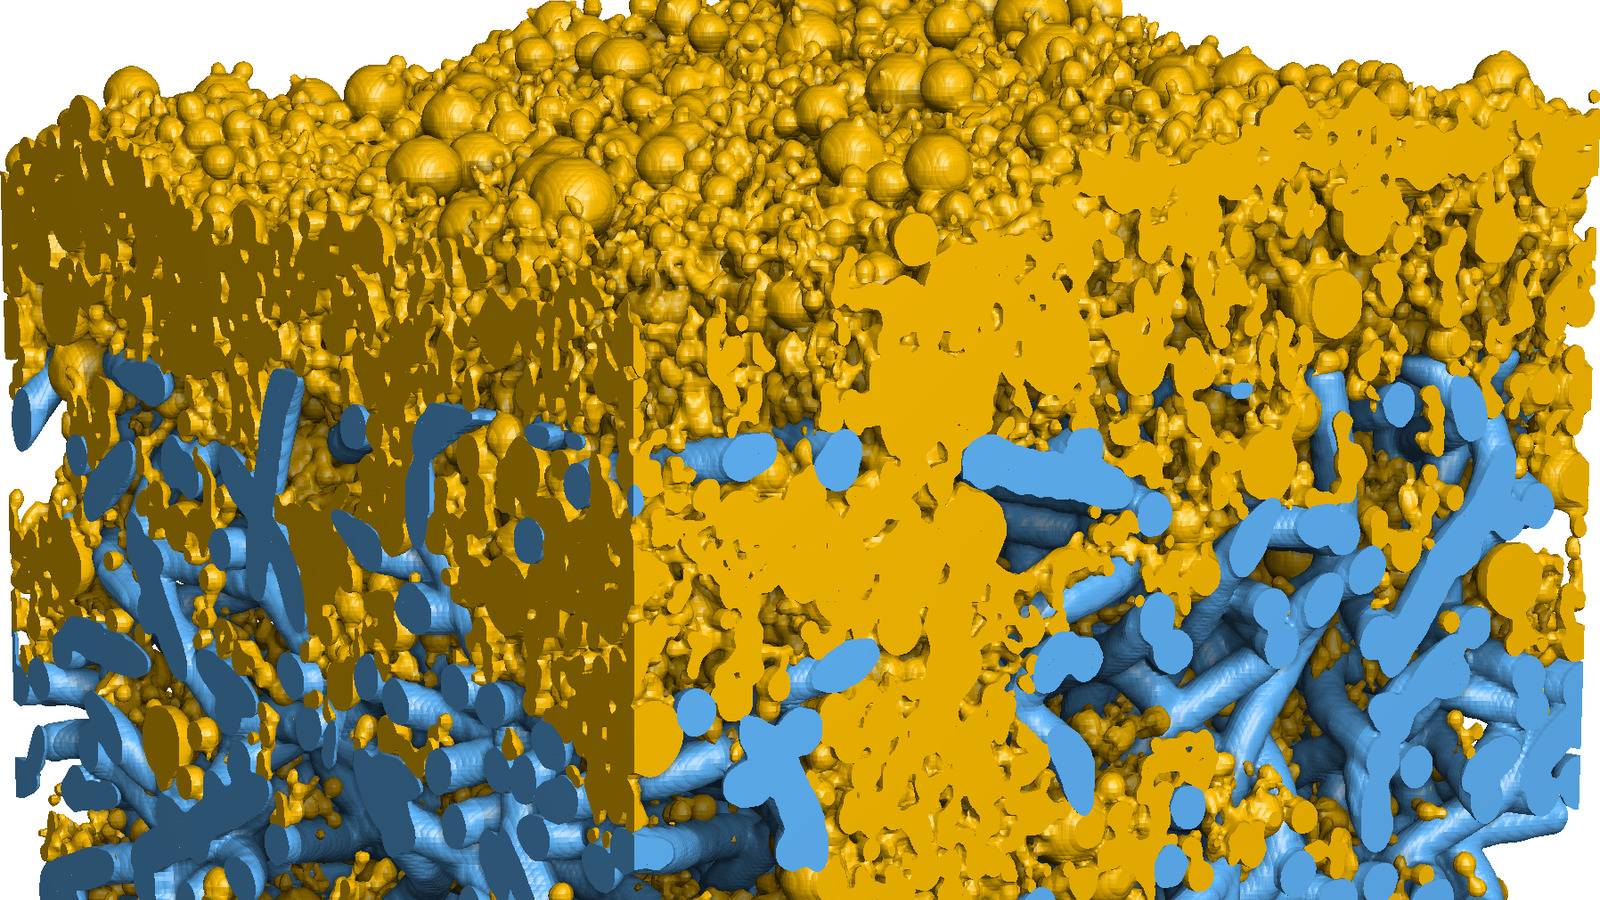
A nonwoven filter medium is mostly empty space, a loose (most of the time) network of fibres, with air between them. Air passes through. Dust particles are captured by the fibres, the larger ones by inertia and interception, the smallest by diffusion, sometimes electrostatic effects also play their part.
Every captured particle narrows the flow channels. At constant face velocity this shows as a rising pressure drop. At a specified final pressure drop the filter is replaced or cleaned. The dust mass per filter area deposited up to that point is the dust holding capacity (DHC), usually given in g/m².
In an empty, fresh filter medium, dust particles are first captured inside the medium. This is depth filtration. As the upstream layers clog, less dust penetrates, and it is deposited on the surface as a dust cake. From this transition on, the pressure drop rises more steeply and nearly linearly with the dust mass.
A filter test characterises the medium. It gives pressure drop, separation efficiency and deposited dust mass as curves over the test time. It does not give the distribution of the dust over the depth of the medium. A simulation does.
In this post, we show a filter simulation with its dust deposition in a nonwoven model.
Nonwoven model and dust
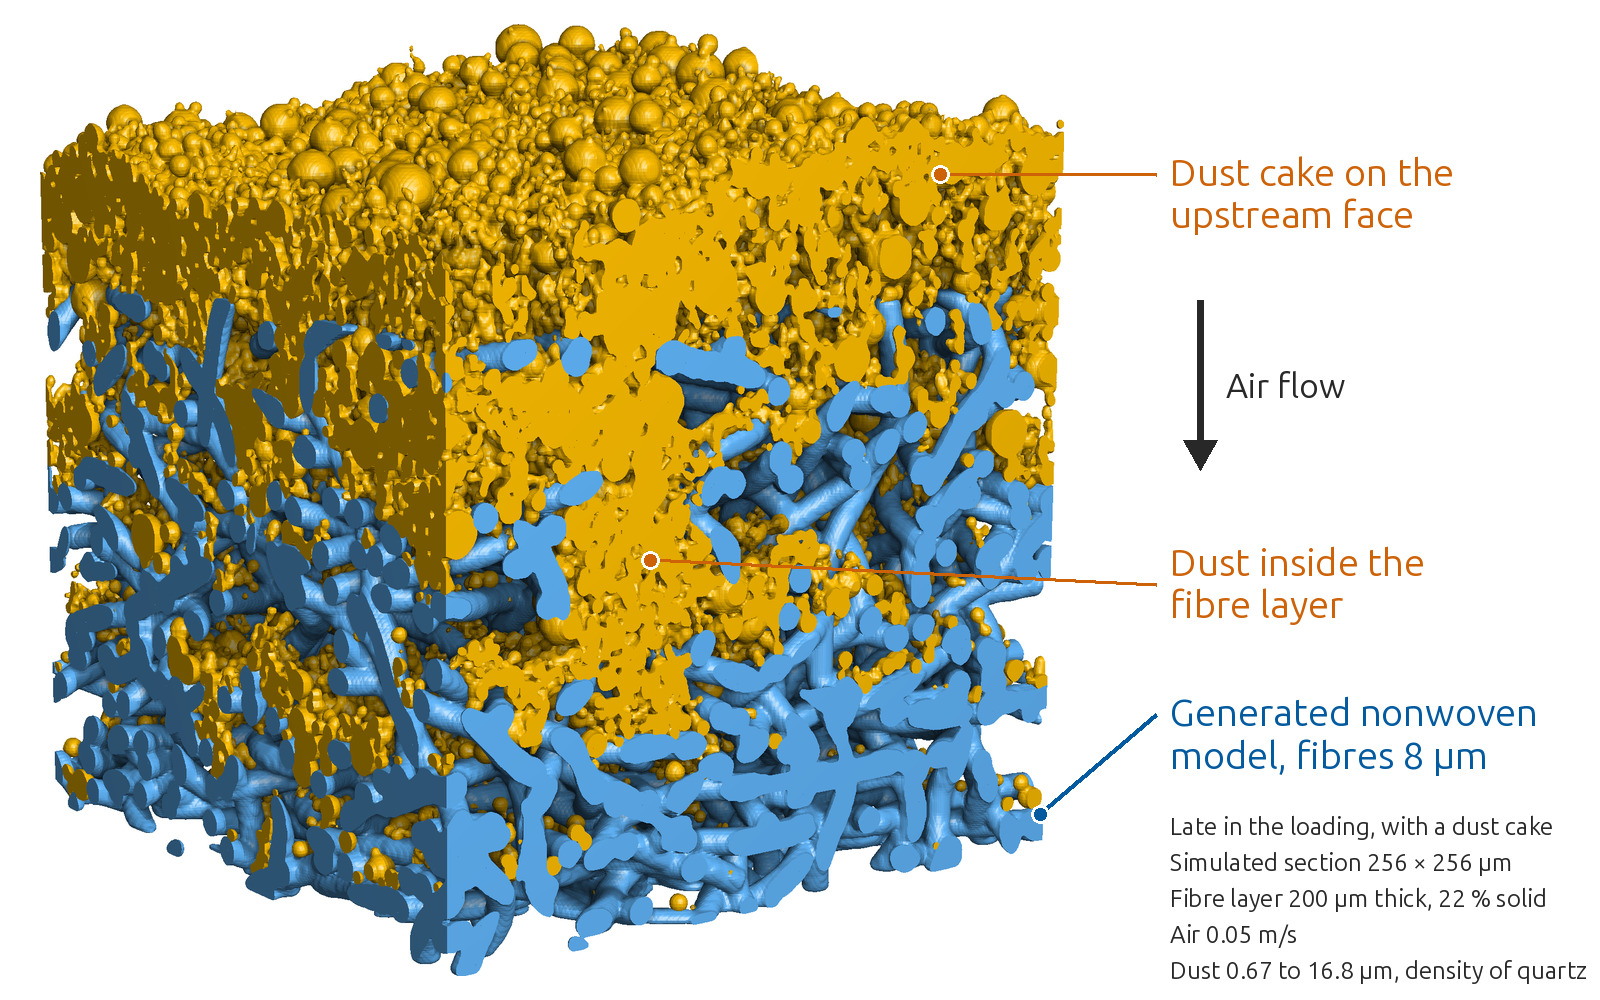
The model is a fibre layer of a generated nonwoven with 8 µm fibres. A small section of it was simulated in GeoDict, with a fine dust of the density of quartz and the air flowing from top to bottom. The dust is added in steps. After each step, the simulation records where the dust of that step is deposited: in the upstream half of the fibre layer, in its downstream half, or in the dust cake in front of the fibre layer.
Depth filtration and dust cake
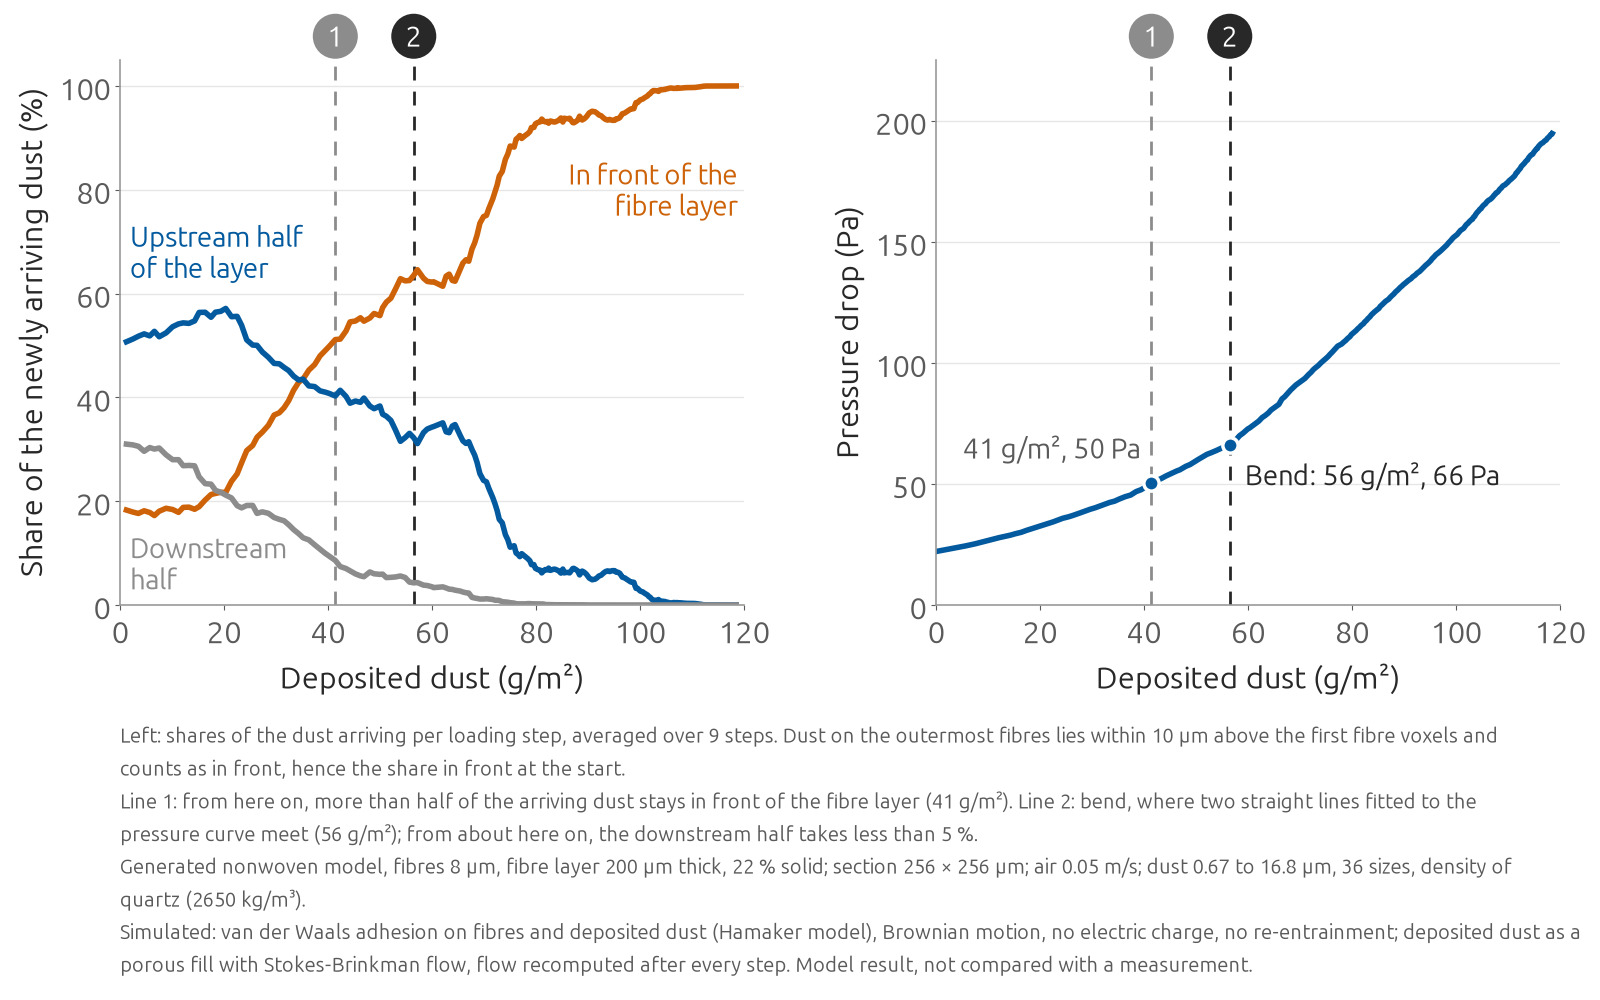
At first, most of the newly added dust is captured inside the fibre layer, more of it in the upstream half. With every step, a larger share is deposited in the dust cake. From a certain deposited mass on, more than half of the newly added dust is deposited in the dust cake.
The pressure-drop curve bends later, when hardly any new dust is deposited in the downstream half of the fibre layer. From there on, the pressure drop rises along a steeper, nearly straight line.
These shares are averages over the section. On the faces of the section, dust is deposited much deeper in some places than in others.
Use in filter media development
The DHC can be read from the pressure-drop curve for a specified final pressure drop within the simulated range. In addition, the simulation gives the total deposited mass at which more than half of the newly added dust is deposited in the dust cake, and the part of it held inside the fibre layer. For a cleanable medium, this dust in the depth largely remains in the medium when the cake is removed by cleaning. For a depth filter, it is the dust held inside the medium.
Candidate media, as models generated from fibre data or built from µCT scans, can be compared by these quantities before a test series is started.
Limits
The results hold for one model and one dust. For another medium, a model or a scan of that medium is required.
Filter media simulation
cvt engineering simulates the dust deposition in a customer’s filter medium in GeoDict, on a µCT scan or on a model generated from its fibre data, with the customer’s test dust and face velocity. The result gives the pressure-drop curve, the DHC, and the distribution of the dust over the depth of the medium as the dust is added.