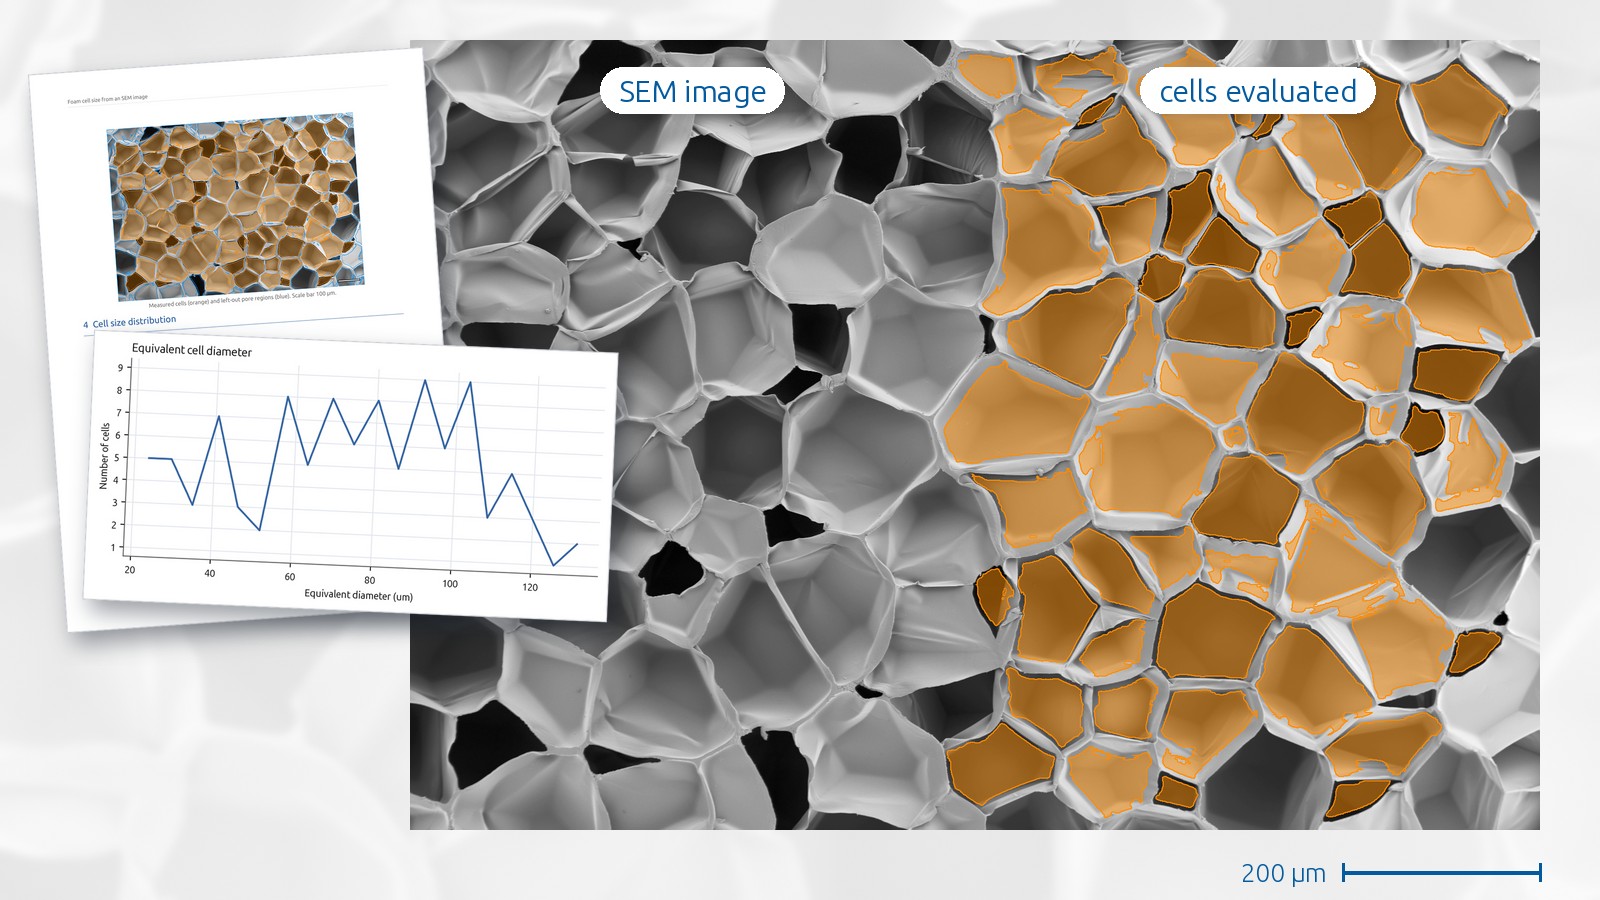
An SEM image shows the cells of a foam, and measuring them by hand is slow. This case study takes one SEM image of a foam and gets the sizes of the cells that lie fully inside it. The work was done in GeoDict.
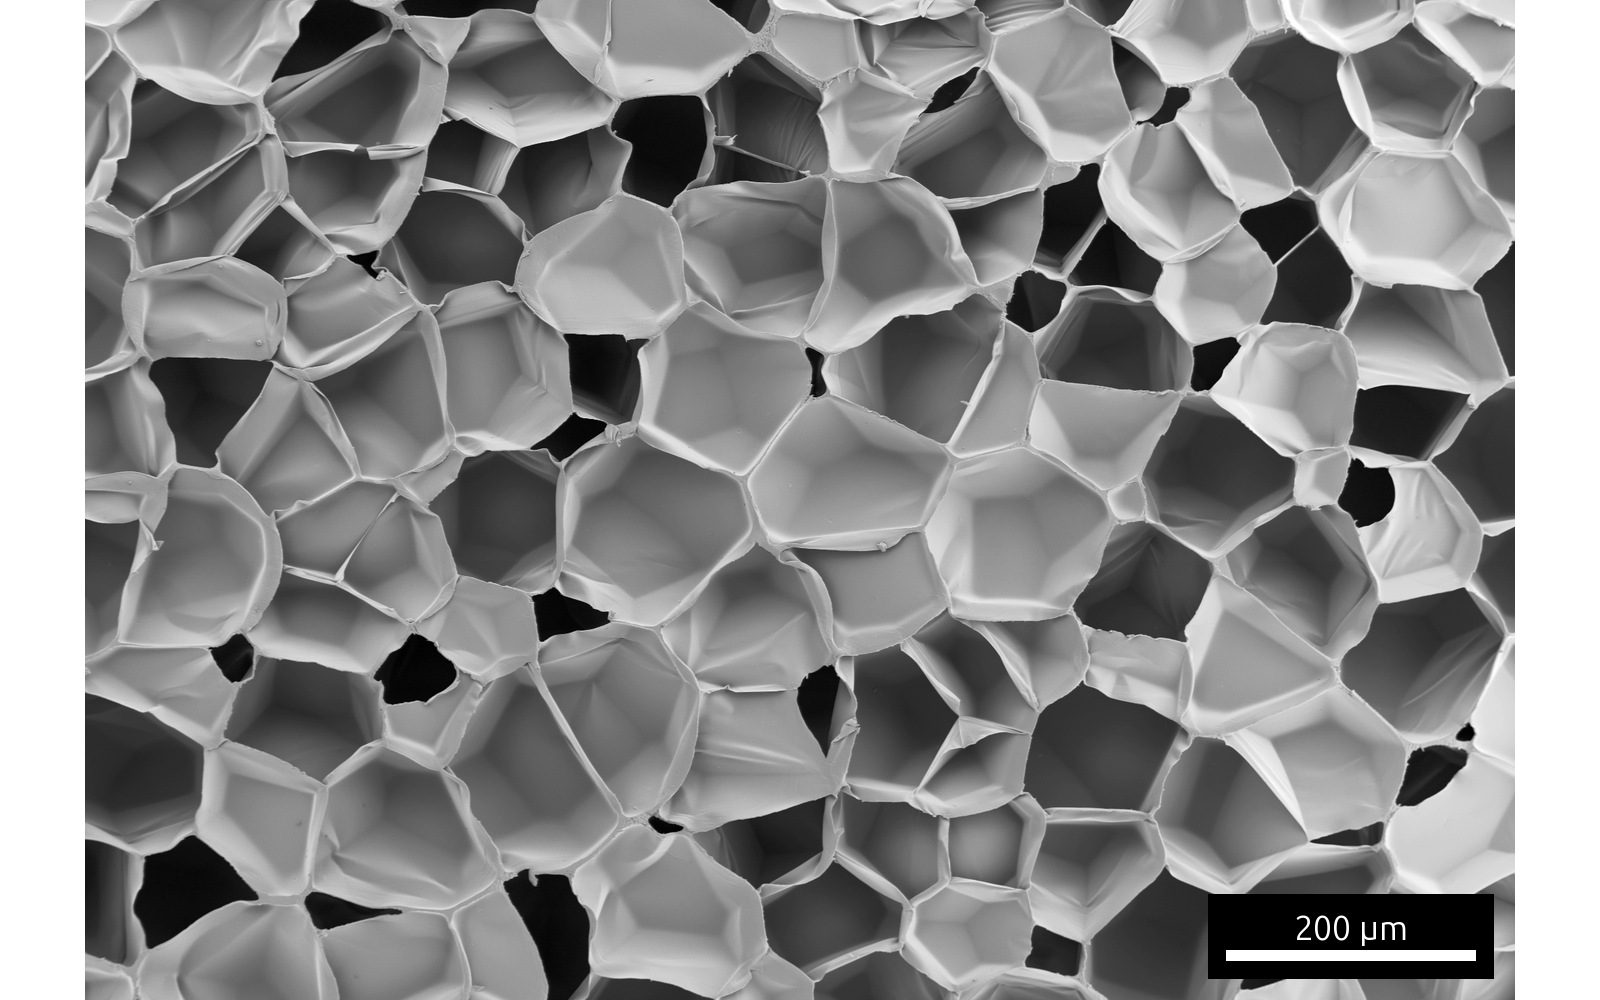
Finding the cells
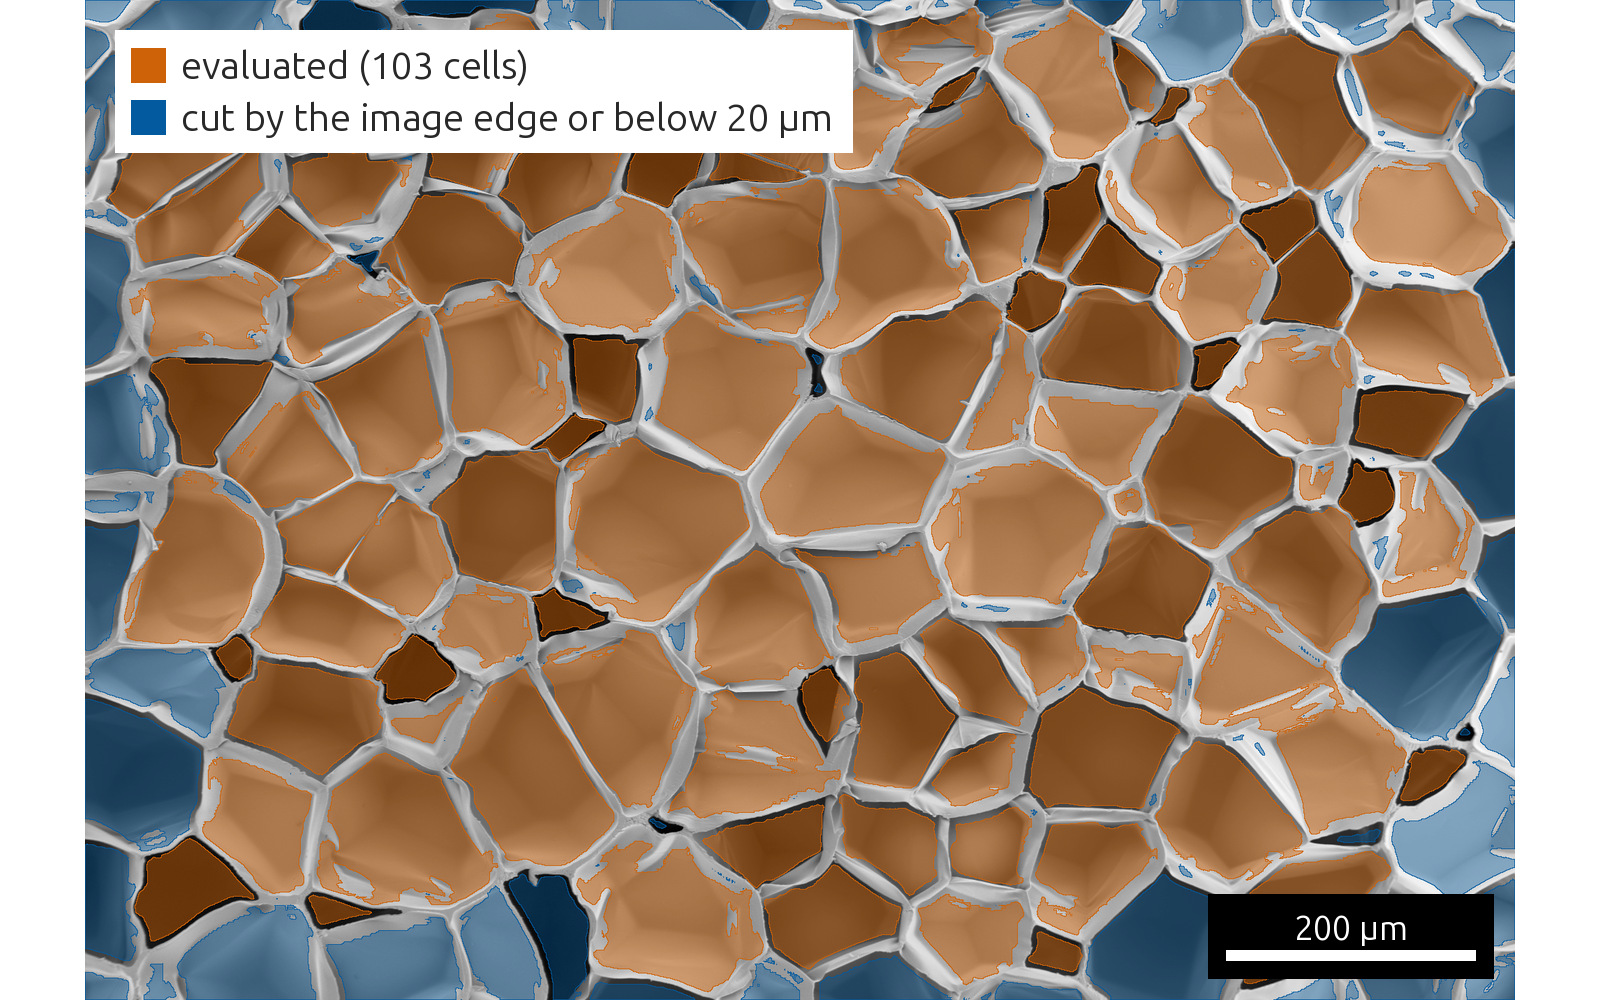
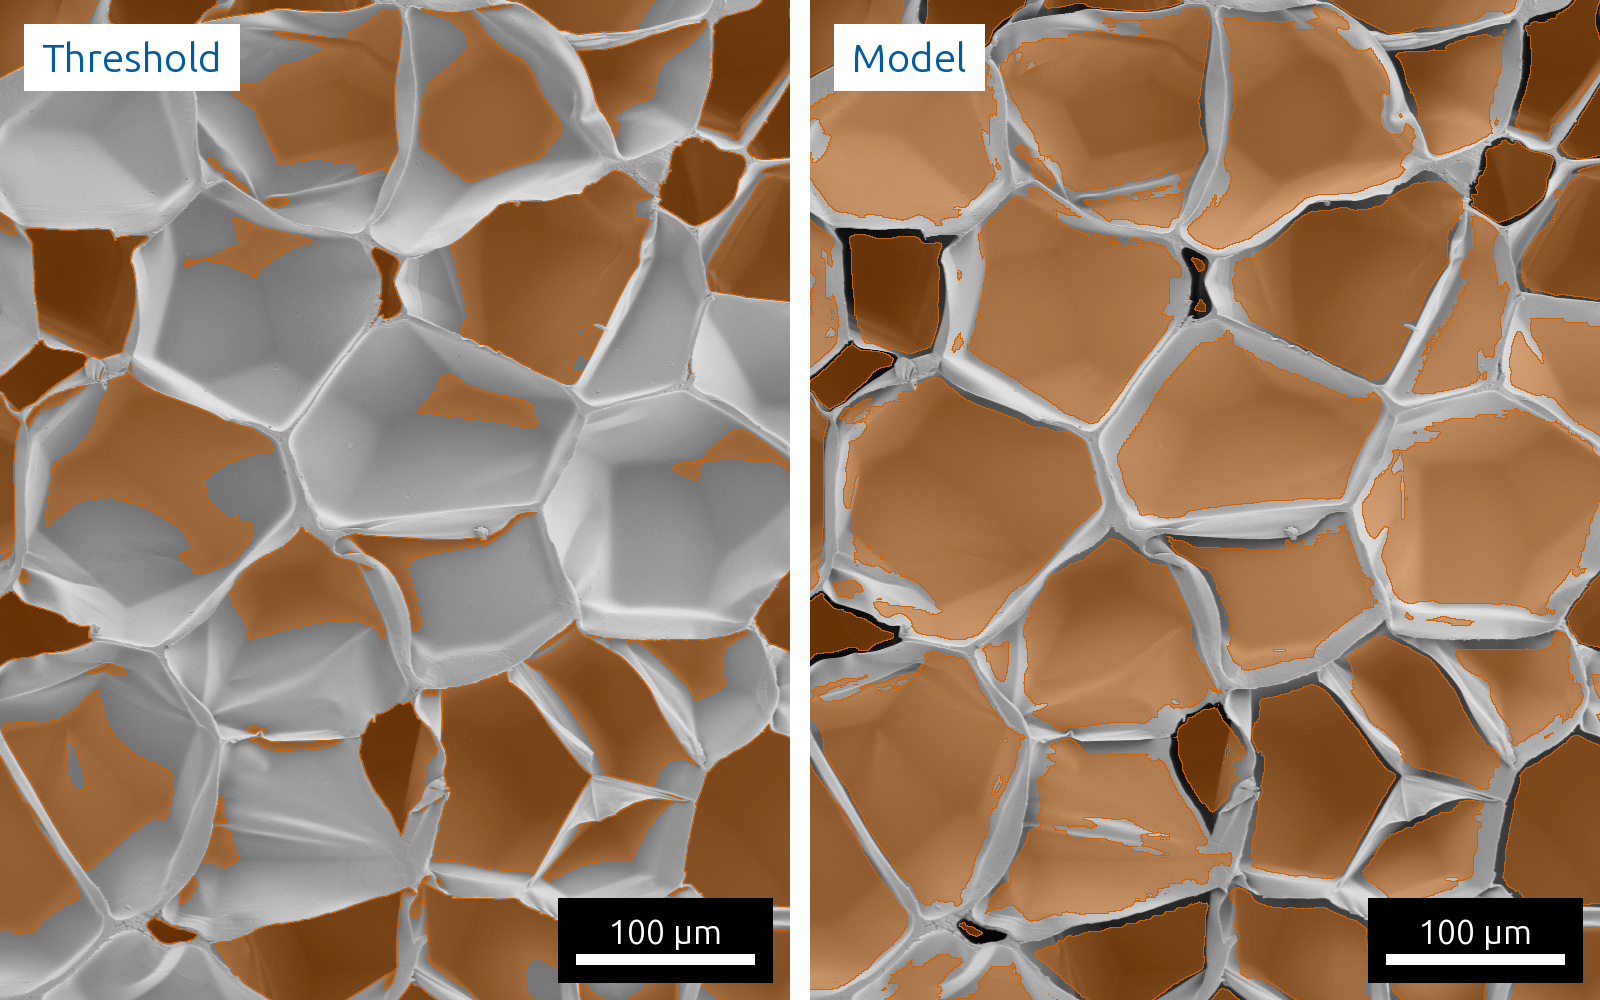
The cells are marked by a 2D U-Net, a neural network for image segmentation, which GeoDict’s AI segmentation applies to the image. cvt engineering trained it on eleven SEM images, this one among them. It marks the cells together with their floors and leaves the walls.
A threshold on the same image
A grey value threshold after Otsu takes the dark openings and the darker cell floors and leaves out the brightly lit cells. The picture shows the threshold and the model on the same detail.
Cell sizes
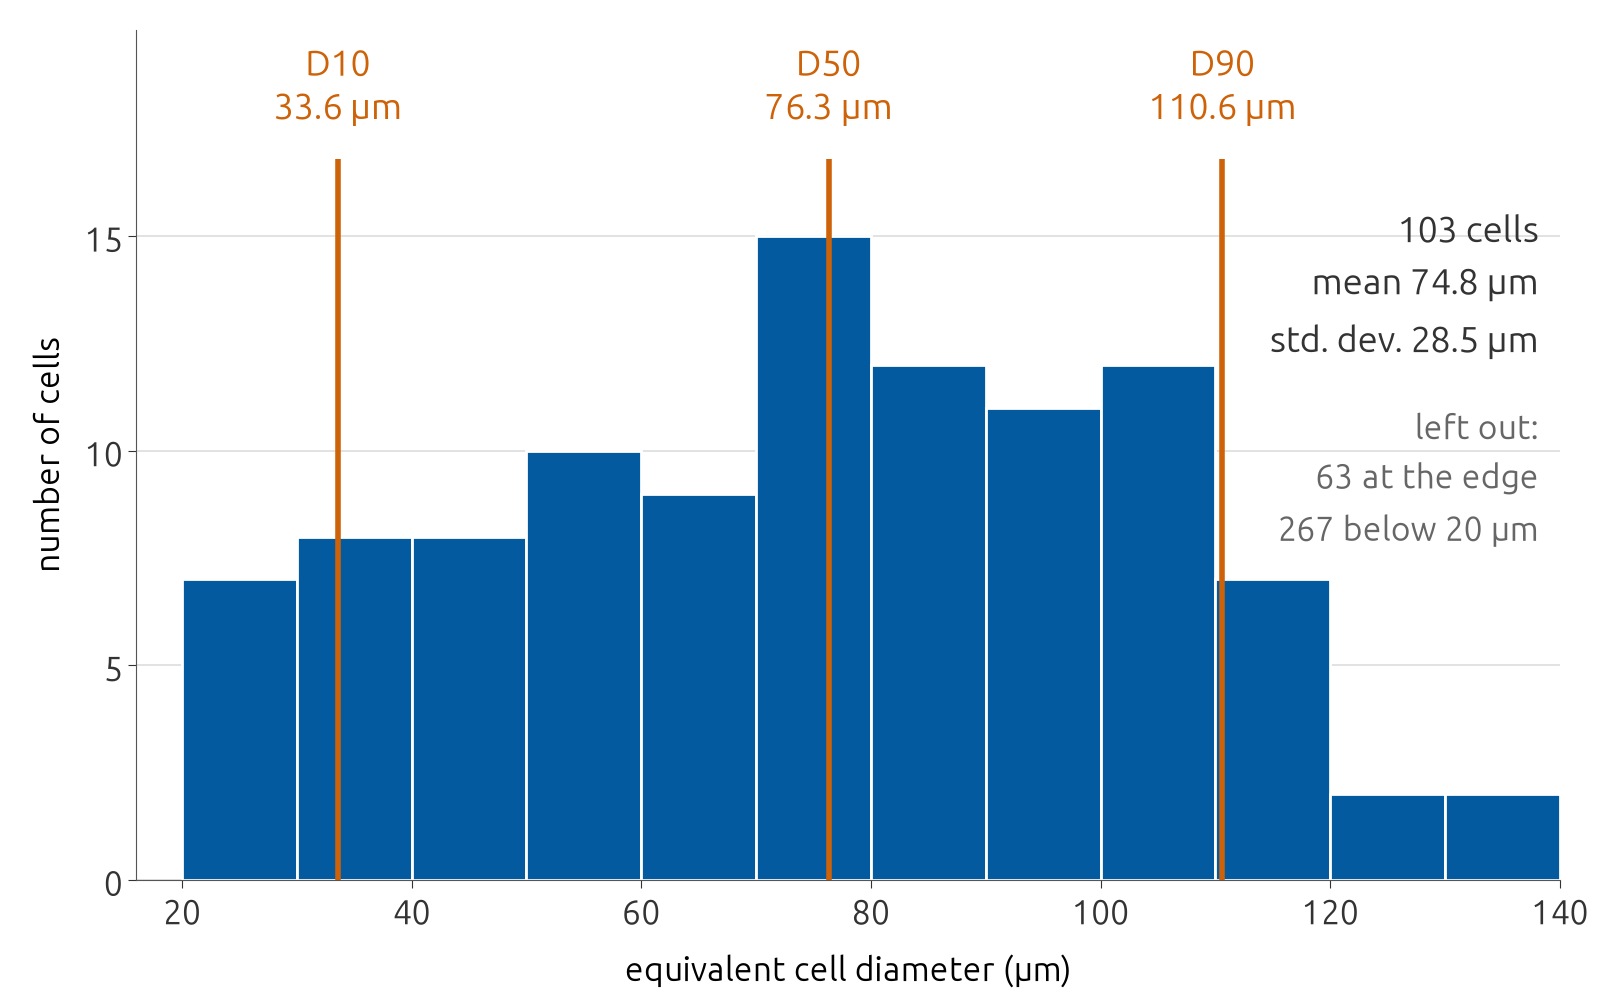
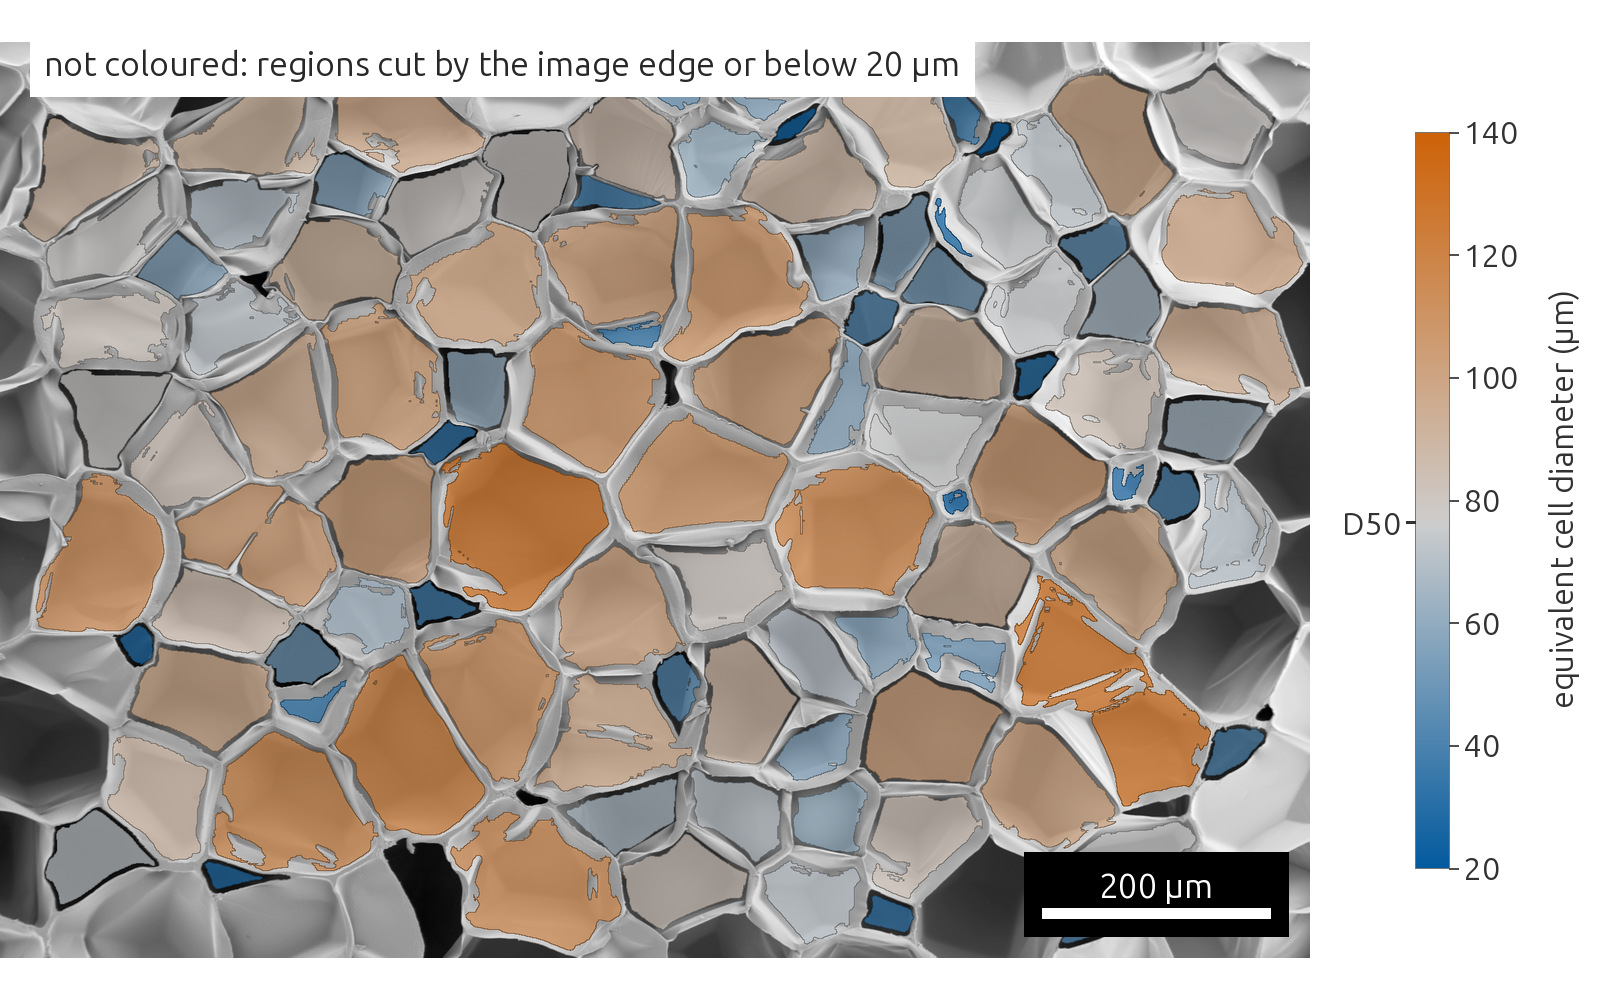
Each connected marked area counts as one cell and gets the diameter of the circle with the same area. Cells cut by the image edge are left out, and so are areas below a minimum size, which the analyst chooses.
Cell sizes across the image
Coloured by diameter, the image shows large and small cells mixed across the field of view.
Limits
The model saw this image during its training, so this is not a test on an unknown sample. The diameters describe the cells as they appear in the image plane and say nothing about their volume.
Made with the GeoDict Copilot
The GeoDict Copilot, the AI agent that cvt engineering develops for GeoDict, ran this analysis. An engineer gave it the image, its pixel size and the model file. The Copilot wrote and ran the GeoDict macros and built the report.